Published on August 2, 2025 by Filip
Last updated on August 2, 2025
The conventional wisdom dictates that cooking at home saves you money compared to ordering food via delivery. But, is this actually true when you factor in the real costs of your time, utilities, and food waste? I analyzed 2025 pricing data from major delivery platforms, grocery chains, and meal kit services across multiple US cities to find out.
The surprising result: When factoring in time costs, scratch cooking from home can actually be more expensive than delivery – unless you cook smart.
My Methodology
To get accurate 2025 data, I examined pricing from 4 major cities, the national average, top-grossing delivery services, grocery chains, and meal kit services:
Cities analyzed: New York, Los Angeles, Houston, Chicago, and the national average
Delivery services: DoorDash, Uber Eats, and Grubhub with full fees included
Grocery chains: Walmart, Kroger, and regional chains
Meal kit services: HelloFresh, Blue Apron, EveryPlate, and others
Then, I compared five cooking methods:
- Restaurant delivery: Full-service meals with delivery fees, tips, and taxes
- Meal kit services: Pre-portioned ingredients with recipes
- Semi-homemade: Using pre-prepped ingredients and shortcuts
- Scratch cooking: Traditional home cooking from basic ingredients
- Batch cooking + leftovers: Smart meal prep and strategic leftovers
I calculated time costs using the July 2025 average U.S. hourly wage of $36.44
Cost Comparison Analysis
These are the results when comparing raw costs for every eating method.
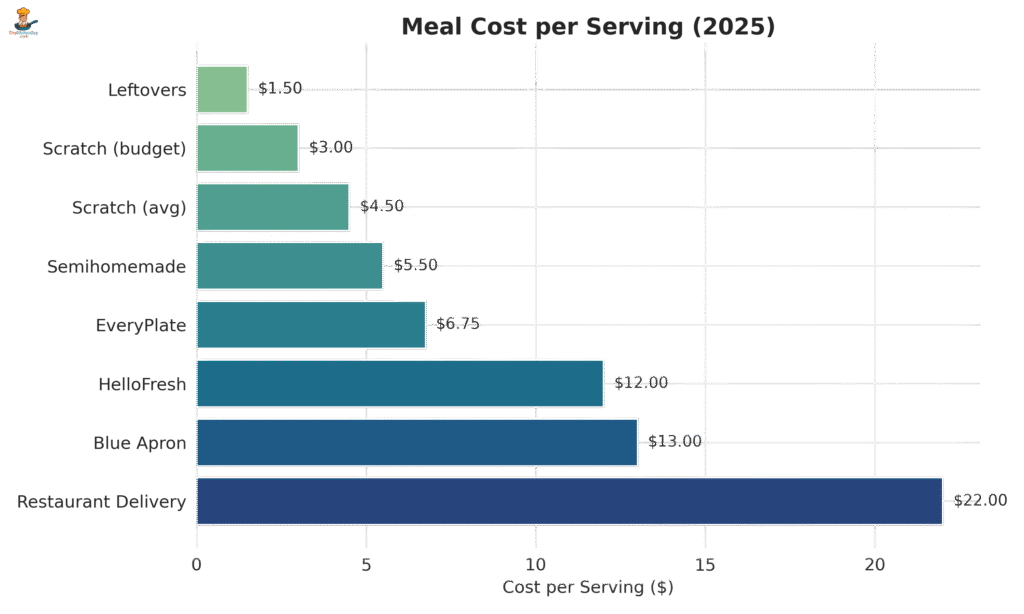
However, the raw ingredient costs tell only part of the story. Here’s what each approach actually costs per serving in 2025:
Time Investment Breakdown
The hidden cost that changes everything is time. Here’s how much time each approach requires:
| Method | Prep Time per Meal | Weekly Time (5 meals) | Time Value at $36.44/hour |
|---|---|---|---|
| Delivery ordering | 5 minutes | 25 minutes | $15.18/week |
| Meal kit prep | 30 minutes | 150 minutes | $91.10/week |
| Semi-homemade | 25 minutes | 125 minutes | $75.92/week |
| Scratch cooking | 45 minutes | 225 minutes | $136.65/week |
| Batch cooking | 15 minutes avg | 75 minutes | $45.55/week |
The time factor completely changes the economics. When you include the opportunity cost of your time valued at the average American wage, scratch cooking becomes the most expensive option at $31.64 per meal, while delivery drops to a competitive $18.54 per meal.
Hidden Costs & Waste
Beyond ingredients and time, several hidden costs have an impact on your true expense:
Food Waste Statistics
- Single households waste approximately $8.50 worth of groceries weekly ($442 annually)
- Families of four waste around $15 weekly ($780 annually)
- 10% of grocery store food never makes it off the shelf
Utility Costs
Cooking at home adds utility expenses that delivery avoids:
- Gas cooking: $3.50-8.00 weekly depending on household size
- Electric cooking: Generally more expensive, $5-12 weekly
- Kitchen supplies: Soap, sponges, cleaning materials add $2-3.50 weekly
Delivery App Markups
This research reveals that delivery services add substantial markups:
- Total markup: 40-60% above menu prices
- Fee breakdown: Delivery fees ($2-6), service fees (10-15%), small order fees ($2-3)
- Regional variation: Los Angeles shows 70% markup, Houston 55%
When Cooking Wins vs When Delivery Makes Sense
Cooking wins when:
- You batch cook multiple meals at once (lowest cost: $11.61 per meal including time)
- You strategically use leftovers
- You have a lower opportunity cost of time (students, retirees, flexible schedules)
- You’re feeding a family (economies of scale)
Delivery makes sense when:
- You earn significantly above the $36.44 average wage
- You’re time-constrained with high-value alternative activities
- You’re single and cooking results in significant waste
The mixed approach often provides the best balance: 2-3 home-cooked meals plus 1-2 delivery meals weekly costs about $214 monthly while maintaining convenience.
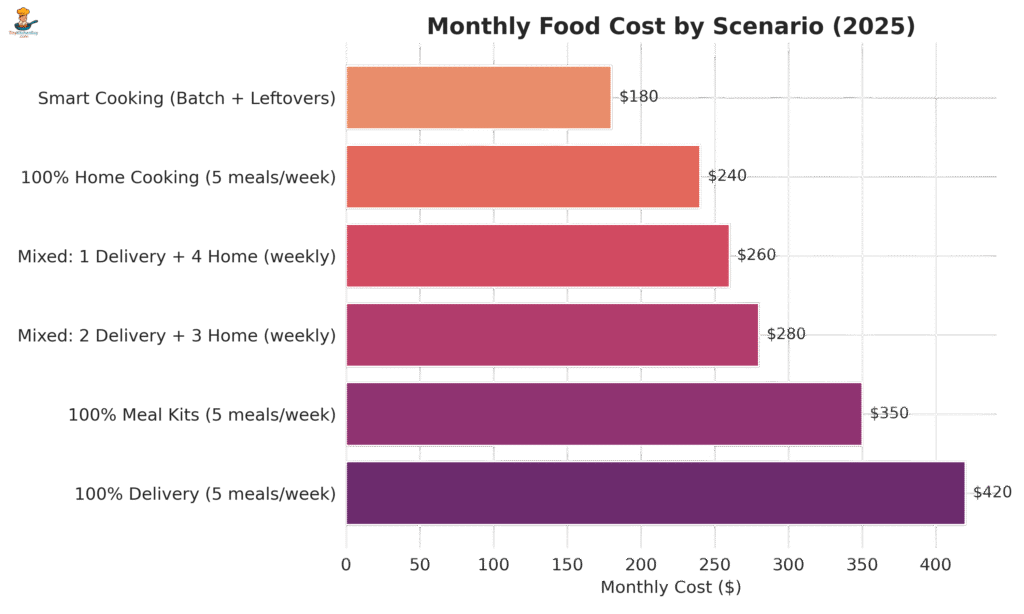
Best Value Scenarios
| Scenario | Weekly Cost | Monthly Cost | Annual Cost | Annual Savings vs 100% Delivery |
|---|---|---|---|---|
| 100% Delivery | $92.68 | $371 | $4,820 | $0 |
| 100% Meal Kits | $138.60 | $554 | $7,207 | -$2,387 |
| Mixed: 2 Delivery + 3 Home | $107.25 | $429 | $5,577 | -$757 |
| 100% Smart Batch Cooking | $58.05 | $232 | $3,019 | $1,801 |
This data shows that smart batch cooking and strategic leftover use provides the best value, saving nearly $1,800 annually compared to full delivery while requiring minimal time investment.
Regional Cost Variations
What’s more, food costs vary significantly across major metropolitan areas:
| City | Weekly Grocery Cost | Average Delivery Meal | Home Cooking Cost |
|---|---|---|---|
| Los Angeles | $297.72 | $19.25 | $5.80 |
| Houston | $286.19 | $16.75 | $4.65 |
| New York | $266.40 | $18.50 | $5.20 |
| Chicago | $269.47 | $17.50 | $5.10 |
Despite lower grocery costs in some cities, the delivery markup still remains significant across all markets.
In Summary
The conventional wisdom about cooking being cheaper holds true – but only with smart strategies. Raw scratch cooking, when time costs are included, can actually be more expensive than delivery. However, batch cooking with strategic leftover use provides the best value at just $11.61 per meal including time costs.
The key insight: It’s not about cooking vs. delivery, but about cooking smart vs. cooking inefficiently. Even incorporating just 2-3 strategic home-cooked meals per week while maintaining delivery convenience can save $757 annually.
For maximum savings, focus on:
- Batch cooking: Prepare multiple meals simultaneously
- Strategic leftovers: Plan meals that create intentional leftovers
- Smart shopping: Reduce food waste through better planning
- Mixed approach: Combine convenient delivery with efficient home cooking
The data proves you don’t need to choose between convenience and savings. However, you should cook strategically when you cooking at home.
This analysis is based on 2025 pricing data from major U.S. metropolitan areas and includes all fees, taxes, and opportunity costs. Individual results may vary based on location, income level, and personal cooking efficiency.
Sources & Data References:
This report is based on publicly available 2025 pricing data from the following services and platforms:
- Uber Eats
- DoorDash
- Grubhub
- Walmart
- Kroger
- Trader Joe’s
- HelloFresh
- Blue Apron
- EveryPlate
- US Bureau of Labor Statistics – July 2025 wage data
- USDA – Estimated food waste statistics
Pricing was averaged across five major U.S. cities: New York, Los Angeles, Houston, Chicago, and a national average.